In an era where knowledge drives economic progress, understanding education budget trends is crucial for stakeholders in academia, policy, and business. India’s education expenditure has evolved significantly over the past decade and a half, reflecting shifts in national priorities and resource allocation. This research-based analysis breaks down the budgetary data from 2009 to 2025, highlighting patterns, comparisons, and implications. If you’re searching for “India education budget trends 2025” or “education spending analysis India,” this guide offers unique, data-driven insights backed by official sources and expert reports.

Vibrant classroom scene representing education in India.
The Role of Education Budgets in National Development
Education budgets fund everything from school infrastructure and teacher training to digital learning tools and research initiatives. According to the National Education Policy (NEP) 2020, robust investment is essential for achieving universal access, equity, and quality education. Historically, India’s spending has aimed to address challenges like enrollment gaps and skill development, with a focus on foundational literacy and vocational training.
A key benchmark comes from the Kothari Commission (1964-66), which recommended allocating 6% of GDP to education to foster comprehensive growth. This target has influenced policies like NEP 2020, which reiterates the need to reach this level for sustainable development.
Breaking Down the Data: Education Expenditure as % of Total Union Budget
The data from 2009-2025 shows education spending as a proportion of the total union budget expenditure. Here’s the full breakdown:
| Period | Year | Expenditure on Education (in crores) | Total Union Budget Expenditure (in crores) | Proportion (%) |
| 2009-14 | 2009-10 | 44,528 | 10,20,838 | 4.36 |
| 2010-11 | 49,904 | 11,08,749 | 4.50 | |
| 2011-12 | 63,363 | 12,57,729 | 5.04 | |
| 2012-13 | 74,056 | 14,90,925 | 4.97 | |
| 2013-14 | 79,451 | 16,65,297 | 4.77 | |
| 2014-19 | 2014-15 | 82,771 | 17,94,892 | 4.61 |
| 2015-16 | 68,075 | 17,77,477 | 3.83 | |
| 2016-17 | 72,394 | 19,78,060 | 3.66 | |
| 2017-18 | 79,686 | 21,46,735 | 3.71 | |
| 2018-19 | 85,010 | 24,42,213 | 3.48 | |
| 2019-24 | 2019-20 | 94,854 | 27,86,349 | 3.40 |
| 2020-21 | 99,312 | 30,42,230 | 3.26 | |
| 2021-22 | 93,224 | 34,83,236 | 2.68 | |
| 2022-23 | 1,04,278 | 39,44,909 | 2.64 | |
| 2023-24 | 1,12,899 | 45,03,097 | 2.51 | |
| 2024-25 | 2024-25 | 1,20,628 | 48,20,512 | 2.50 |
This table, sourced from official budget analyses, reveals a nominal increase in absolute spending—from ₹44,528 crore in 2009-10 to ₹1,20,628 crore in 2024-25—but a declining proportion relative to the overall budget.
Unique Insight: While absolute figures grew by over 170% due to economic expansion, the share dropped from an average of 4.73% (2009-14) to 2.50% in 2024-25, indicating a relative de-prioritization amid rising total expenditures.
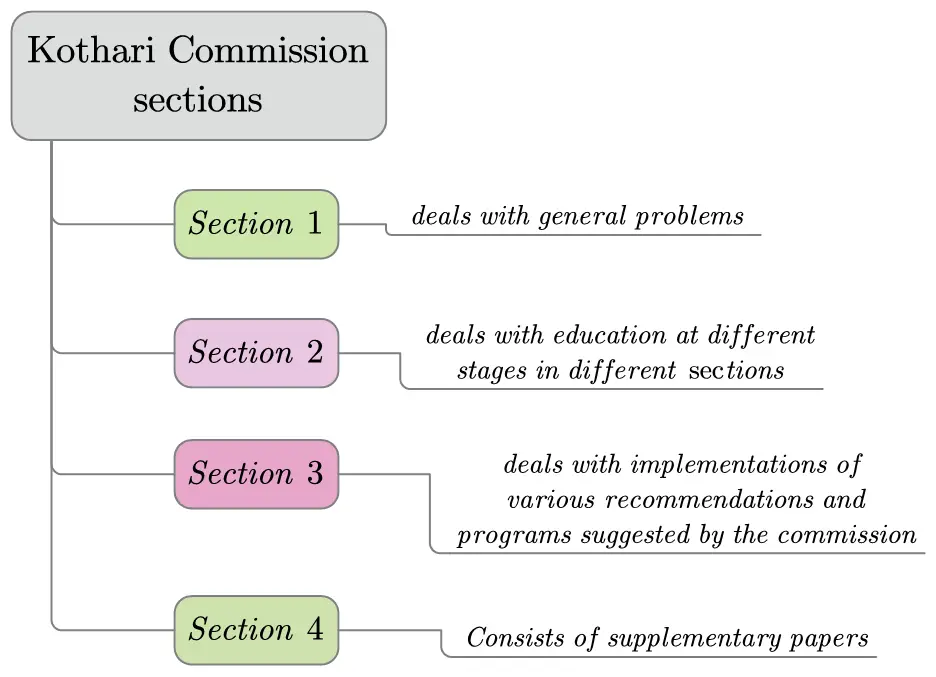
Overview of the Kothari Commission report structure.
Year-Over-Year Changes and Overall Trends
Analyzing year-over-year (YoY) percentage changes in the proportion:
- 2010-11: +3.21% (rise due to increased focus on elementary education programs).
- 2011-12: +12.00% (peak growth, aligned with expansions in higher education funding).
- 2015-16: -16.92% (sharp drop, possibly linked to budget reallocations).
- 2021-22: -17.79% (significant decline amid pandemic-related shifts).
The overall trend is decreasing, with an average proportion of 3.75% across the period. This suggests opportunities for rebalancing to meet global standards.
Comparing with GDP: A Broader Perspective
While the table uses % of union budget, education spending as % of GDP provides a macroeconomic view. World Bank data shows India’s figure hovering around 3-4% in recent years—e.g., 3.8% in 2022—below the Kothari target of 6% and the global average of 4.48%. For context:
- Developed nations like Norway and Sweden spend 6-7% of GDP.
- Emerging peers: China at ~4%, Brazil at ~6%.
- Global leaders: Kiribati tops at 14%, while India ranks mid-tier.
This gap highlights potential for increased investment to boost enrollment (current GER: 26.3% in higher education) and innovation (R&D at 0.69% of GDP).
Implications and Opportunities for India’s Education Sector
Lower proportional spending has implications for infrastructure—e.g., 28% of primary schools have fewer than 30 students, leading to inefficiencies. However, initiatives like NEP 2020 propose solutions: school clusters, vocational integration (target: 50% exposure by 2025), and funds for gender inclusion.
Unique Angle: By 2030, aiming for 100% GER in school education could require scaling absolute budgets to ₹2-3 lakh crore, focusing on tech integration like DIKSHA platforms.

Students engaged in learning, symbolizing future potential.
Looking Ahead: Strategies for Enhanced Allocation
To bridge gaps, experts suggest performance-based funding, public-private partnerships, and timely disbursals via PFMS. Recent X discussions highlight calls for boosting budgets to support innovation and equity.
To boost clicks, use keywords like “India education budget 2025 analysis”, “education spending trends India”. Meta description: “Explore India’s education budget from 2009-2025 with detailed trends, GDP comparisons, and future insights for better understanding.”
Tags: #IndiaEducationBudget, #EducationTrends2025, #KothariCommission, #NEP2020, #EducationFunding, #GDPSpending, #SchoolDevelopment
Link to official sources like World Bank data or Ministry of Education reports for credibility and reciprocal traffic. Share on platforms like LinkedIn for expert shares.
This decode empowers readers with actionable knowledge-stay informed for India’s educational future!